Send this to your favorite AI and keep the conversation going.
April4, 2024 | Marianna Vydrevich & Jeff Metersky, SCB Contributors
This article is published on the SupplyChainBrain website, here: https://www.supplychainbrain.com/blogs/1-think-tank/post/39270-overcoming-data-pitfalls-for-reliable-supply-chain-network-design

Supply chain network design (SCND) is a branch of operations research that involves translating business rules into a data model to solve optimization problems. SCND helps in strategic decision-making about the nodes (production and storage locations), sourcing (optimal assignment of production and storage nodes to end customers), transportation modes, and inventory levels.
Effective SCND can result on average in a 10% to 12% reduction in costs annually, but cost isn’t the only objective. An effective model can help find the optimal solution for combining diverse business objectives such as market share, resilience, agility and sustainability.
Regardless of the questions that senior stakeholders will be posing, the foundation of SCND is a comprehensive, solid and accurate data mode. This article discusses the main pitfalls that supply chain analytics teams should be aware of as they prepare the data.
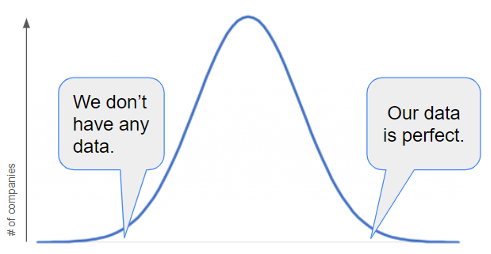 Chart #1: Perception of data quality across companies
“Our data is perfect” is an extremely rare phrase. “We don’t have any usable data” isn’t a very common one either. The vast majority of companies are somewhere in between. Dealing with uncertainty is what businesses work with every day, and it’s probably a gap in analytical thinking that prevents people from being mentally ready to work with datasets that haven’t been curated.
Sometimes a company is considering starting SCND, but there’s a prevalent “we don’t have any usable data” mindset. It’s counterproductive to wait for a mythical “data maturity” state in order to start modeling. It’s the other way around: Once the team begins modeling, it quickly learns exactly where the data gaps are. Then it becomes possible to develop a plan to close them over time.
It’s a misconception that it’s paramount to have actual historical costs for every single lane in the network in order to begin modeling. What’s much more important is the understanding of how different cost components stack in the total cost to serve an average customer. For example, if the outbound freight is responsible for only 10% of the cost while raw materials make up 70%, the SCND team should dedicate a corresponding amount of time to each cost bucket based on its relative importance. 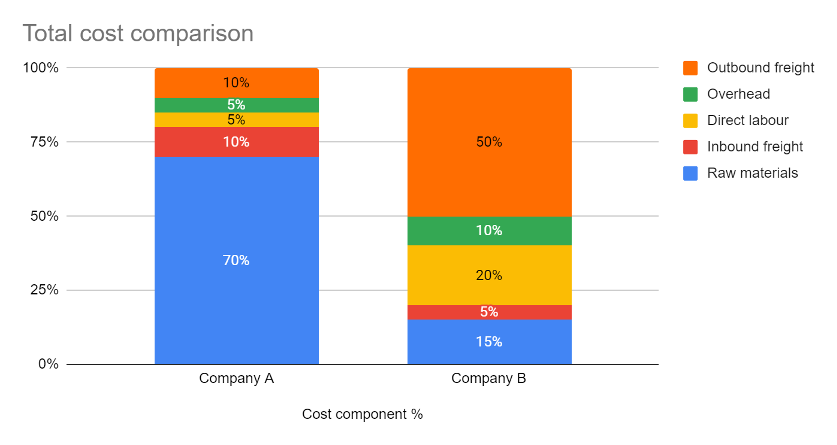
Chart #2: Cost structure comparison between two different types of companies
The approach and focus to filling in the data gaps differs between companies. That said, following are the pitfalls to avoid.
Relying on standard product hierarchies for data aggregation. Raw transactional data is almost never used for SCND. Take a company with a typical sales structure: 1,000 SKUs, where 80% (800) have a near-zero annual sales volume, and 20% (200) account for 80% of the demand. Modeling the 200 SKUs will most likely yield the same result as modeling all SKUs, but the SCND team will spend significantly more time on data preparation. This means that the team needs to come up with a strategy for aggregating the raw data.
Data aggregation is at the very core of SCND. It’s a critical and fundamental building block. Getting it right differentiates a model that brings in actionable insights from one that doesn’t.
Every company has a product hierarchy that transcends throughout the organization and helps bring structure to reporting and decision-making. It’s tempting for the SCND team to select one level (for example, brand or group) and use it in the model.
| SKU (level 0) | Brand (level 1) | Group (level 2) | Category (level 3) |
| SKU1 | Small box | Box | Wood products |
| SKU2 | Medium box | Box | Wood products |
| SKU3 | Big Pallet | Pallet | Wood products |
| SKU4 | Straw | Plastic | Plastic products |
Table #1: Product hierarchy example
However, it’s prudent to ask the following question before making that call: Is there a uniformity of production rates, handling specifications, costs and price within the same level?
It’s not good practice to aggregate seemingly similar products (such as small and medium boxes) if there’s a considerable variance in the supply chain characteristics. For example, if the modeling is done at a group level, and demand is aggregated for all boxes together but there’s only one plant in the network that’s capable of running small boxes, it will be impossible to derive usable insights from the model’s results.
Instead of relying on sales, marketing or planning product aggregators, the team should gain insight into how various departments prefer to use product hierarchy, understand the cost structure, and make a decision. Finance, for example, might prefer to use categories, since pricing is the same within one category while transportation needs to go down to group level since product dimensions vary greatly between boxes, pallets and plastics. In most cases, the model will end up having a hybrid product structure where it goes down to the brand level for some products, up to the category level for others, and perhaps even break out certain atypical SKUs as standalone items. In the end, the critical strategy is to look for the common characteristics of the SKUs and develop logistically distinct product groups.
The same logic should be used to aggregate customers in the network.
Using shipment history as demand. There’s a built-in bias in any shipment history: the throughput capacity and inventory availability that the whole network had at any given time. Plant closures, strikes, outages, adverse weather events and prior sourcing decisions all play a role. So in order to build a true baseline model, it’s important to ask “what is the true, unconstrained demand that our business should be fulfilling at every moment in time?”
Using order history is an alternative approach, but it’s not error-proof either, as customer behavior has to be considered. If there’s no penalty for order cancellation, and customers know what kind of allocation is in place during demand spikes, they’ll put in extremely large orders very early on, then get what they really need and cancel the rest.
The SCND team should work in lockstep with the demand forecasting team and scrutinize the data in order to build a real unconstrained demand picture that incorporates lost sales. 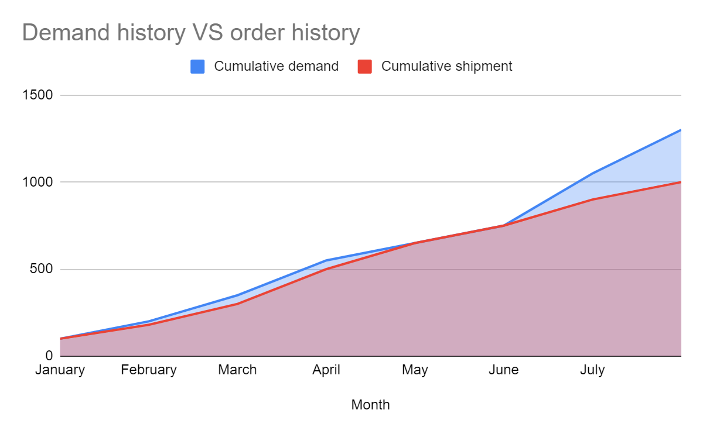
Chart #3: Demand history versus order history
Chart #3 illustrates a typical demand picture: Shipments were equal to production at the start of the year, then demand took off and shipment lagged, then production caught up for two months and, as summer came, demand spiked again.
Assuming linear cost structure.
Chart #4: Cost per unit vs volume
Most of the data that SCND teams work with is historical. Earlier on we discussed analyzing total costs in order to understand what to focus on. What that picture doesn’t have is the logic behind the cost. For example, historical costs have been $5 per unit because the company only produced or purchased very small quantities. If the volume increases, the costs go down — sometimes exponentially. It’s extremely important for the SCND team to be cognizant of such non-linear costs, as they can sway the results of an optimization.
Focusing on deterministic optimization versus stochastic considerations. It’s tempting to design a deterministic mode, considering every input (such as demand, cost, and freight) as a single number. For many years, this approach was widely recognized in the industry as the standard way of working.
In reality, there’s built-in variation in every aspect of the supply chain. For every numerical value in a model, there’s a distribution — a range of possibilities. It’s not uncommon to have a network in which one month it makes more sense to supply customer A from plant 1, but long-term it’s more cost effective and reliable to have this customer supplied by plant 2. In order to find the true optimal and resilient supply chain, the SCND team should consider incorporating stochastic data inputs that represent inherent uncertainties and variations. In essence, the key is not just to plan for the “average” scenario but to prepare for the full spectrum of possibilities, ensuring a more adaptable and resilient supply chain strategy.
The journey from raw data to reliable supply chain network designs is marked by a series of challenges that require careful navigation. By being cognizant of the pitfalls and adopting a holistic, dynamic approach to data interpretation and model construction, businesses can create resilient, efficient and adaptable supply chain networks, capable of withstanding the tests of an ever-evolving global market.
Marianna Vydrevich is manager of operations research and network optimization with GAF. Jeff Metersky is vice president of solution strategy with GAINSystems.
This article is published on the SupplyChainBrain website, here: https://www.supplychainbrain.com/blogs/1-think-tank/post/39270-overcoming-data-pitfalls-for-reliable-supply-chain-network-design
Send this to your favorite AI and keep the conversation going.